


Julio Car[1], Ana Galant[2], Mateo Paulisic[2], Jasmina Sestan[2], Ana Bonaca[3], Stefan Cikota[4]
- [1] XV. gimnazija, Zagreb, Croatia
- [2] Pazinski kolegij - klasicna gimnazija, Pazin, Croatia
- [3] Faculty of Science, Department of Physics, Zagreb, Croatia
- [4] Faculty of Science, Department of Physics, Zurich, Switzerland
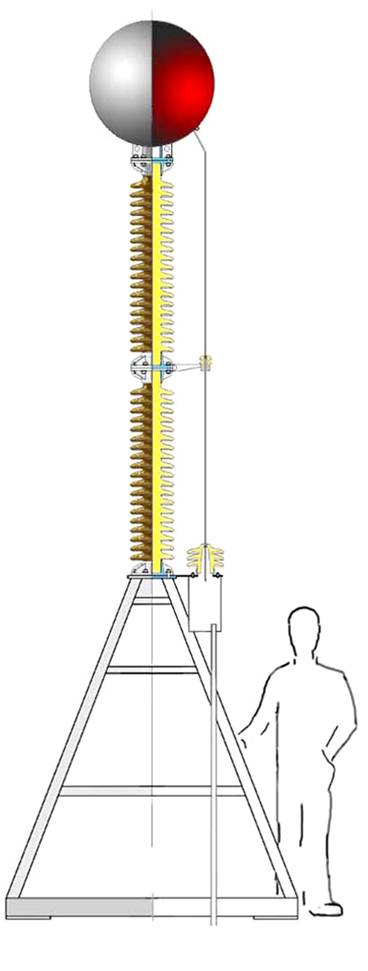
Image 1: Schematics of the ULF antenna
Meteors are one of the most popular objects on the sky for visual observations. However, it is not so well known that meteors are sometimes followed by certain acoustic sounds. Those sounds are divided in two groups - normal and electrophonic sounds. Normal sounds are the one we hear within few seconds or minutes after the meteor has passed. That happens because the sound coming from a meteor, passing through the atmosphere, takes certain time to travel to the observer on the ground. Unlike normal, electrophonic sounds happen simultaneously to the meteors (usually fireballs).
Electrophonic sounds
Today theory states that they happen at the same time with the meteor because they are electromagnetic waves and, thus, travel at the speed of light. Although there is no confirmed physical explanation of EM waves formation, it is assumed that they are produced by trapping and tangling of the Earths magnetic field in the turbulent plasma wake of an ablating meteoroid. A refinement of this theory is suggested in which ULF radio burst is produced by explosive disintegration of a fireball. According to this theory, the charge separation takes place during the airburst of the meteoroid due to propagating shock wave through ionized meteor plasma. Rapid and strong electric fields are produced by the charge separation and they produce low frequency EM radiation (below 500 Hz). Because of such low frequencies they are not easy to detect. The ultra low frequency antenna makes thus, a good instrument to detect them.
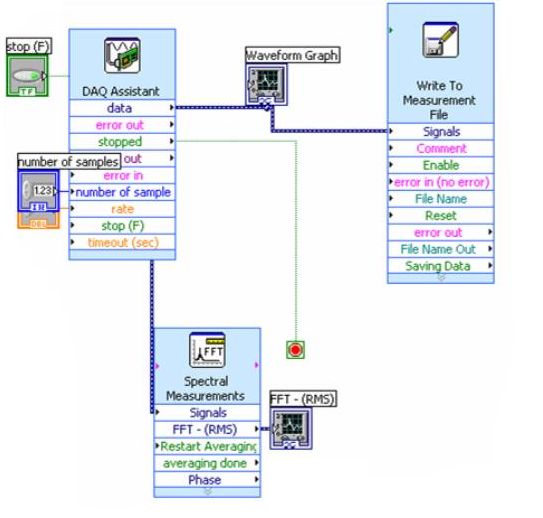
Image 2: Labview program for data acquisition and analysis
Goals
Main goal of our project was to establish functioning of our ULF antenna (situated at the Tican Observatory near Vinjan) and accordingly detect ultra low frequency electromagnetic waves. Also, our goal was to record electrophonic sounds. In order to achieve our goals we needed to test the amplifier, decrease impedance and increase power line which is produced due to potential difference between ULF antenna and Earth. First step towards detecting ultra low frequency EM waves was to record Schumann Resonance by which we can prove that our instrumental setup works.
Schumann resonances
Because we can consider that Earth and ionosphere are spherical conductors and they are in homogenous electrical field, charge is induced on their surface and there is an electrical tension between them because the ionosphere is positively charged relative to negatively charged Earth. Because of unconducting air between Earth and ionosphere, standing EM waves are formed in cavity between them. This cavity acts as a conductive waveguide and because of finite dimensions of Earth it acts as a resonant cavity for the standing EM waves in ultra low frequency. This cavity is naturally excited by lightning. Those standing EM waves are called Schumann resonances and they appear on 7.8, 14.2, 20 Hz and so on. Detecting them would mean that our equipment works appropriately.
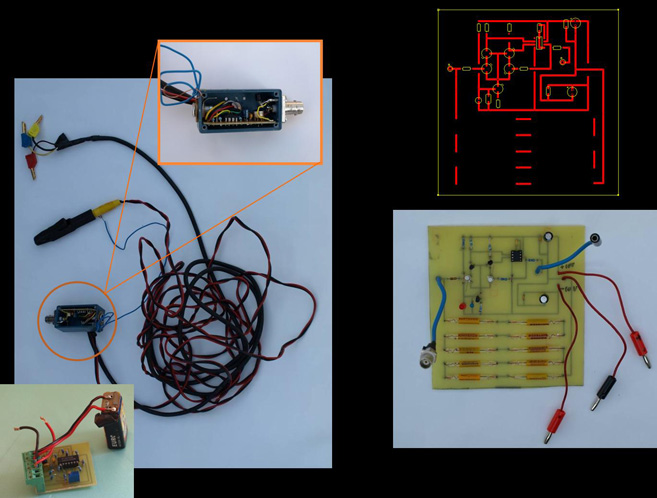
Image 3: Used amplifiers (left - old, right - new, bottom left - Damir Segon's)
Instrumental setup
ULF antenna consists of several parts (see Image 1). On the top is a big isolated metal ball (radius 40 cm) below which is ceramics for isolation (240 cm high) and metallic and stone grounding (200 cm high). When meteor passes through the atmosphere, it disrupts the charge in the ionosphere. That implicates on creating electromagnetic wave which induce the voltage on the ULF antenna. This voltage signal goes from the top of the antenna to the amplifier (or voltage follower) which is connected to the Data Acquisition card (DAQ) on the computer. DAQ is (among other) a voltmeter which in our case measured the potential differences between the antenna and the Earth.
We made a program in software LabView to process the data (see Image 2). It takes 10 seconds of measurements from DAQ and shows potential difference and Fourier transforms of the signal on the graphs and also outputs these measurements in a file for future processing.
In order to get a signal as clean as possible we tested three amplifiers (see Image 3). Beside the old electronics which was functioning well, but still not tested by us, we also built our own electronics via scheme (we found the scheme on the internet) which we rewrote in a program called PCB Express. The third amplifier was given to us by Damir egon, from Croatian Meteor Network.
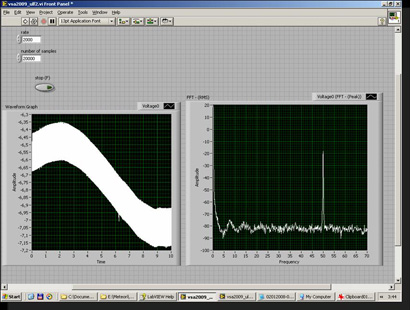
Image 4: Acquired signal (left) and its Fourier transform with Schumann resonances present (right)
Results
The best result we gained from the old amplifier when we detected Schumann resonances (see Image 4)! The old setup was built with two operational amplifiers. The input was arranged as a female coaxial antenna jack and the output as a non standard coaxial antenna jack, the system used the housing and the ULF antenna grounding for the power source grounding. Considering that no one managed to get cleaner signal for the same time of acquisition, we made a great success.
But, we werent so lucky with the two remaining amplifiers. The second amplifier we tested was our own, but results of its testing werent as good as the first one. The problem with second amplifier was seen on graphs where we had constant potential difference (see Image 5) between ball antenna and ground, meaning that either there was malfunction on amplifier or ball antenna was saturated with induced charge.
Fixes
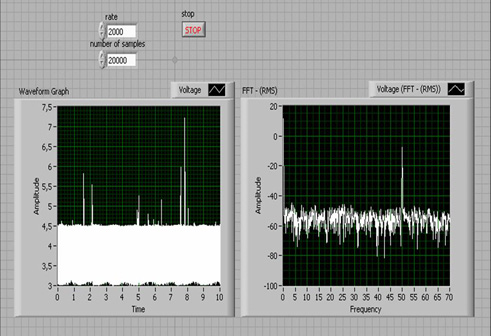
Image 5: An example of noisy signal without Schumann resonances
Same problems occurred during testing the third amplifier so we attempted to fix whatever the problem was. Following days were dedicated to repairing of all electronics. Unfortunately the first, only successful amplifier needed to be fixed too, because polarity inversion burnt some of its components. We checked the whole circuit via scheme and changed transistors and operational amplifiers which are the most sensitive parts. We did the same for the other circuits.
After days spent on repairing amplifiers it looked like our effort was futile because the only thing we got was still pretty big noise and the frequency of power line (50 Hz), which was lost when the first amplifier broke down. Amplifiers were tested by connecting them on ULF antenna and measuring the potential difference between amplifiers output (signal) and ground. Usually we got constant unchangeable voltage. Although we did some alternative checking by putting an additional grounding and voltage measurements, we concluded that there could be some malfunction on cable coming from ball antenna, which is amplifiers input. So we changed it and built the leakage path that way in order to prevent charge saturation of ball antenna. Following measurements done in LabView software showed us better results, although not as good as those from the first amplifier in the beginning.
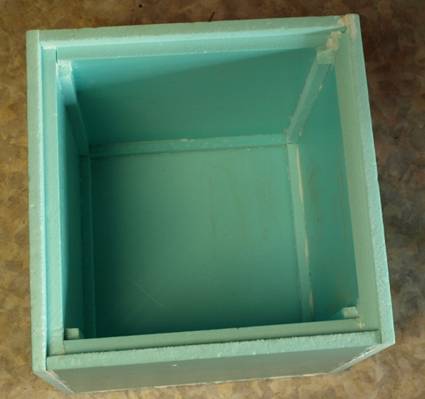
Image 6: Microphone housing for detection of electrophonic meteors
All those repairs took the time, so in the end we havent achieved all the goals we planned. Our first test gave a cleaner signal compared to the previous tests of the system. By using the new electronics the signal was hardly recognizable except for the 50 Hz peak.
Recording electrophonic sounds
Regarding the direct recording of the electrophonic sounds weve started building an acoustic isolated box (see Image 6). It was made of styrodur (60x60x65 cm). The tests we made using LabView for tracking amplitudes and a software-speaker signal generator showed that the average reduction of the box was 16%. The test consisted of recording the same scale of different sound frequencies with the microphone outside and inside the box. Afterwards we were able to compare the amplitudes of both probes and calculate the difference. On higher frequencies the efficiency reached even 40%. Around the frequency of 400 the signal was stronger inside the box than outside which is explained with the resonant frequency of the box on 392 Hz. Future steps are to complete isolation of the box to reach the level of the highest efficiency and preventing the box from resonating.
Literature
- Instrumental recording of electrophonic sounds from Leonids fireballs, Zgrablic et al, Journal of geophysical research, vol. 107, NO. A7, 10.1029/2001JA000310, 2002
- Global Electrophonic Fireball Network, http://www.gefsproject.org/electrophones/