


Ivana Barisic[1], Dino Bektesevic[2], Neven Golenic[3], Lucija Sabaric[4], Aleksandar Cikota[5], Dijana Vrbanec[6]
- [1] Gimnazija Titusa Brezovackog, Zagreb, Croatia
- [2] Gimnazija Cakovec, Cakovec, Croatia
- [3] XV. gimnazija, Zagreb, Croatia
- [4] V. gimnazija, Zagreb, Croatia
- [5] Faculty of Science, Department of Physics, Zurich, Switzerland
- [6] Faculty of Science, Department of Physics, Zagreb, Croatia
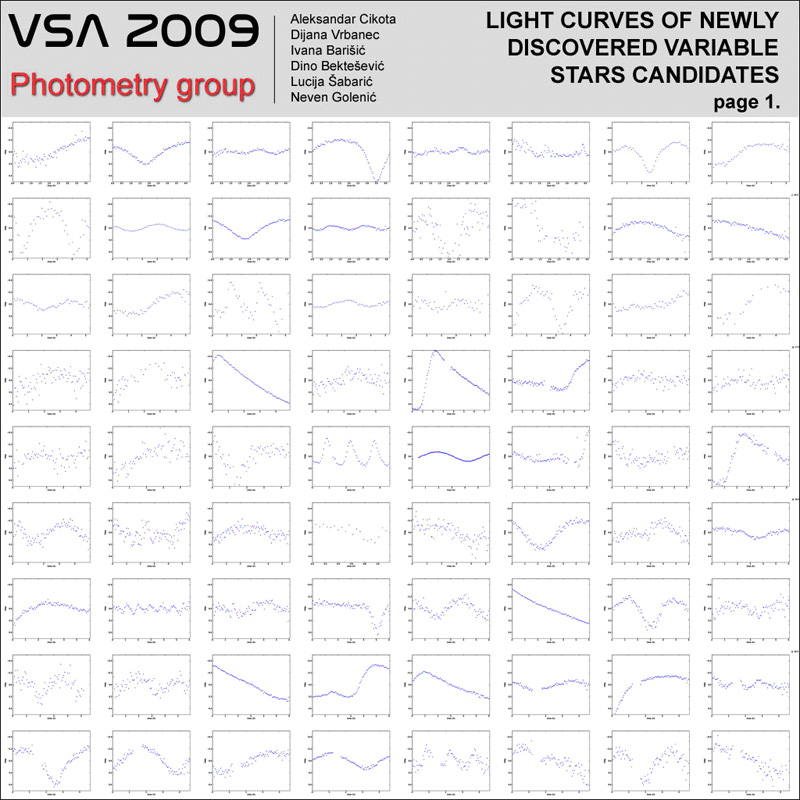
Image 1: Light curves of variable star candidates
The photometry group's primal goal was to process 20 GB of images from Tel Aviv Observatory (1.800 images) in search of new variable stars. We had 18 nights of observing and every night was observed a different field in the sky.
One of the problems was that we had too much data which had to be processed. If we followed the old way of searching for variable stars we would have to take measurements for each star on the picture individually. Problem with that is obvious - there are 1.800 images; to search for variable stars in so many images would take us forever. This is why we had to think of a way of automating the search.
First we had to sort out flats, darks and biases from regular images, because we got all the images sorted only by date of observing and not by type. We used Python to write a script in it that would do that job for us.
After that we had to calibrate the images to reduce noise and “bad” pixels. We did that in an astronomical software called MaximDL.
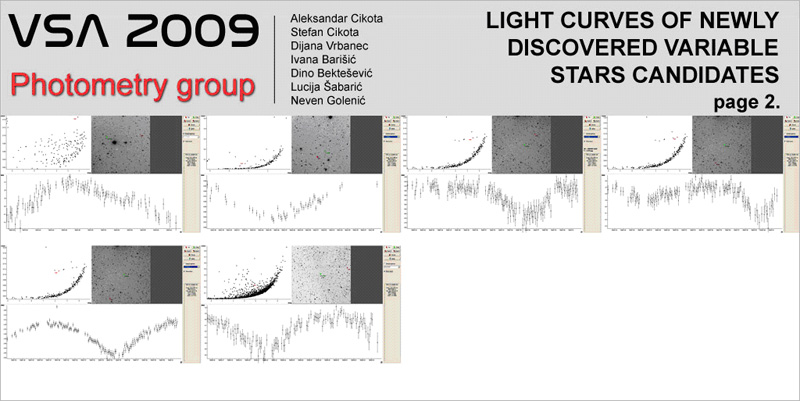
Image 2: Light curves of variable star candidates
Then we used a script written in Python by our mentor Aleksandar Cikota that performed astrometry and photometry of every star in the images. This script was a high level script using PinPoint Astrometric Engine to read out photometry and astrometry data for each star on the images and write them in a .txt file, so that later we could reduce those data using other scripts. The output format was expressed in numbers. So we wrote a script that uses that data and plots a light curve in a more easy-to-read graphical format. This script plotted time on x-axis and magnitude on y-axis. Now we had to scroll trough all the images and sort out curves of possible variable stars.
Our work resulted with 80 variable stars of 35.000 plots we had. We wanted to find out which of them were known and which of them were unknown. For that we used Python again to create a list that included right ascension, declination and average magnitude of each possible variable star. We needed right ascension and declination to look for those variable stars on the internet pages of AAVSO (American Association of Variable Star Observers) in the VSX (International Variable Star Index). According to VSX database 72 of 80 variable stars we found were new ones.
The next step was to try to determine types of new variables.
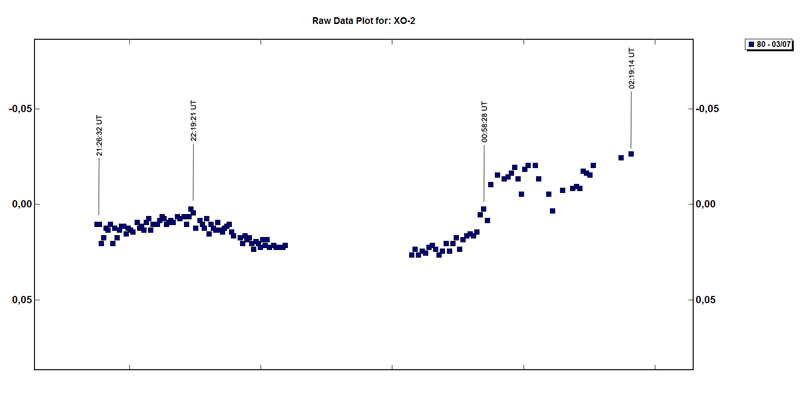
Image 3: XO-2 light curve made in Canopus
After we finished the search for new variable stars, we started a new research about extrasolar planet XO-2. We did photometry of XO-2, whose transit was taken from La Sagra Observatory in last March, in MPO Canopus.
Because we had some extra time, we also began a search for new LPV-s (long period variables or mira (ο Ceti) stars) that were considered as potential miras in Višnjan Observatory database. For that we had to check them in other databases. We wrote a script in Python that extracted the name of each star, its right ascension and declination from html documents. Then we looked for those stars by coordinates in the SDSS (“The Sloan Digital Sky Survey“), internet sky maps. We also searched for them in the SIMBAD and got a list of potential new mira variables which need to be checked in the future more carefully.